Search This Blog

Monday, February 27, 2012

Squeezing the coconuts


The “big three” dairy alternative beverages—soy milk, rice milk and almond milk—have become increasingly mainstream, such that “dairy alternatives” may eventually give way to a term such as plant milks, or even to a dairy-free descriptor that sheds reference to the king of the dairycase altogether.   Nonetheless, shelf-space competition and consumer substitutions will tend to keep these products in opposition, with battles won and lost based on relative advantages and disadvantages in price, flavor, food sourcing and processing, product nutrition and fortification, and food intolerances. 
But there’s also the role of novelty.  Generally speaking, consumers of plant milks are a more adventurous bunch than those who drink cow’s milk. Experian Simmons data show, for example, that 50% of whole milk fans like to try out new food products, compared with 60% of soy milk fans.  Similarly, 21% of whole milk fans describe themselves as quick to try out new nutritional products, compared with 34% of soy milk fans.  (Organic dairy milk consumers are an exception to this general pattern, falling in with the plant milks crowd.)
The need for the new among plant milk consumers has, in turn, helped almond milk steal thunder from soy milk.  According to a Packaged Facts survey conducted for our Dairy Alternative Beverages (January 2012) report, 40% of soy milk drinkers are drinking more of this product than they were five years ago, a stat worrisome to dairy milk producers.  At the same time, 62% of almond milk drinkers are downing more of this product than they were five years ago, a stat worrisome to soy milk producers.
But not to diversified producers such as Dean Foods, which is not only the leading U.S. processor and distributor of milk and related dairy products, but the owner of WhiteWave, Silk, and Horizon Organic, among other national dairy and dairy alternative brands.  Sales figures for WhiteWave refrigerated dairy alternatives, as tracked by SymphonyIRI, tell the story of ongoing churn in the plant milks market—and of successfully navigating these currents.  Soy milk still accounts for three-fourths of WhiteWave sales in this segment, but while sales are flat or down for the Silk soy milk product lines, they are booming for Silk Pure Almond (up 66% for the 52 weeks ending January 22, 2012), and surging for the debut year of Silk Pure Coconut, launched in March 2011. 
Simply being new or unexpected doesn’t equate to success in the plant milks market, of course, as is obvious from the modest sales of hazelnut milk or oat milk, which have been on the market for a number of years. A successful launch in the plant milks arena should have a unique and cleverly executed marketing message that emphasizes taste and a compelling nutritional story, while perhaps also rafting the white waters of novelty.  Here is where non-diversified dairy milk producers are at a disadvantage.  It’s not that milk producers can’t play the novelty card:  as observed in Freshness: Culinary Trend Mapping Report (February 2012), a joint publication of Packaged Facts and the San Francisco-based CCD Innovation, “regular milk remains a supremely fresh and popular product, now with all kinds of styles and forms bursting from the dairy case—organic milk, all levels of fat, new chuggable flavored milks, raw milk, goat milk, you name it.”   All of those new styles and forms, however, run the risk of eroding the primacy (in this country) and seeming inevitability of dairy milk—of downgrading dairy milk from king of the dairycase to merely first among equals.  The more that marketers create distinctive versions of dairy milk, the less original it becomes, even when those variations are beneficial; milk starts to shed the very naturalness and authenticity that is evoked (however fancifully) by product names such as soy milk or almond milk.  While plant milks can play the field, dairy milk can’t do new product cartwheels without giving up some high ground.


The venerable “Got Milk?” campaign from the California Milk Processor Board holds this high ground with a “real milk comes from real cows” slogan and a website that opens with retro milk bottle graphics and a “many imitations—still no equal” tossing down of the gauntlet.   WhiteWave, however, has no qualms about taking on what "Got Milk?" calls the real thing.   WhiteWave boasts that “Silk Pure Coconut  provides 50% more calcium than dairy milk—yet is completely lactose free,” and provides a nutritional table that shows 2% milk comparing unfavorably with Silk Pure Coconut in calories, calcium, cholesterol, and sugars.  With a stealing-a-page promise of “fresh, creamy taste,” Silk Pure Coconut recommends itself straight up, in your morning coffee, and for savory or dessert recipes, while Silk’s Facebook page shows plant milks being poured over breakfast cereal and paired up with chocolate chip cookies.   At least for its leading U.S. processor and distributor, milk is no sacred cow.

Sunday, February 19, 2012

Despite economic headwinds, restaurant sales start their reignitions

While the U.S. economic recovery remains fragile, the restaurant industry is finding ways to spell relief. The FoodserviceLandscape in the U.S., our outlook report for the restaurant industry, projects that sales will grow 4.2% to $487 million in 2012, on the heels of 6.1% market growth in 2011.

Nonetheless, operators must continue to experiment aggressively with menu pricing strategies and focus on courting minority racial/ethnic groups—and prepare for profit margin compression.  The onus of food commodity price increases is sizeable enough to threaten the restaurant recovery unless restaurant operators are prepared to bite the bullet on profit margins.  Continuing a trend that gathered momentum in 2011, many operators will need to maintain menu prices at the expense of higher margins or risk losing customers.

In addition, demographic-specific employment trends will continue to have disproportionate consequences and create distinct opportunity micro-climates by restaurant industry segment and geographic zone.
Although the housing market remains in a trough, consumer spending is rising modestly. Household debt ratios have declined, which bodes well for the discretionary income growth needed to increase guest traffic and perk up guest check averages.  Food and accommodations spending is outpacing other personal consumption expenditures.  Moreover, restaurant companies will increasingly leverage the technological and marketing power inherent in the smartphone. Location-based services such as Foursquare are a relatively new aspect of social media, but we expect quick uptake to continue among consumers and foodservice operators.

By segment, full-service restaurants posted the highest growth rate, at 8.1%.  Fine dining had a moderate rebound in 2011, though the hill back to 2007 spending levels remains very steep. Growth in the restaurant breakfast (5%) and snack (8%) customers has outpaced population growth since 2008, and the overall percentage of consumers using restaurants for these occasions has increased—although the reverse trend holds among Generation X.  All natural and organic are not only the most prevalent health-related claims on restaurant menus, but their menu presence grew during 2007-2011.   In 2011 menus, 15.7% of restaurants featured a natural claim and 13.5% featured an organic claim.  Not surprisingly, the tendency to market these claims on menus rises with restaurant price points.

Consumers age 65 or over are spending significantly more (13%) on limited-service restaurants than they did in 2007. Millennial generation consumers, at the other end of the age spectrum, are spending significantly more on limited-service restaurants as well as full-service restaurants.

By household income level, those with an income of $100K or more generate over one-third of spending on meals at restaurants, even though they comprise only 17% of all households.  The number of higher-income households and of lower-income households has grown since 2007, while the number of middle-income households declined. Because restaurant spending correlates to household income, the crimping of the middle class is obviously and inevitably a major hurdle for the industry, as for the national economy overall.  

Packaged Facts estimates that the number of restaurant visits grew by 3% during 2008 to 2011, based entirely on population growth, not usage increase.  Even then, restaurant operators across restaurant segments contend with the increased numbers of lower-spending guests and decreased numbers of higher-income guests, which has translated to higher volume but lower guest check averages.

And food commodity price increases could set the restaurant industry back, threatening the modest sales recovery seen in 2010 and 2011. Such price increases have the potential to erode the pricing gains restaurants have made relative to grocery prices, creating increased incentive for consumers to eat at home, and throw into disarray the delicate balancing act so many restaurant operators now walk in planning their menu strategies, which rely more now than ever on hitting the appropriate pricing and food margin mix.  Facing reduced consumer discretionary income and higher rates of unemployment, some of the industry’s major chains are pursuing sales growth by creating sister brands or new brands that are cut from fast casual cloth. Enticements include expansion opportunities, reduced capital investment, and new customer bases.

Most importantly, further employment gains are needed to spur overall restaurant industry growth. Consumers age 18-24, those without high school diplomas, and African-American consumers in particular remain saddled with unemployment rates much higher than the average.

Poaching is in the cards in the consumer payments industry


With household incomes declining even as healthcare costs and student debt are rising, the overall consumer payments pie is shrinking, prompting payment providers to base profit growth strategies on taking market share from their competitors.  And with that strategy comes a renewed focus on marketing to specific demographics.  Through target marketing, competitors in the consumer payments industry can optimize the potency of each product-differentiating feature, mastering new payment and communication channels, and building loyalty programs based on cost sharing with merchants to maintain or grow market share.

Some consumer payment basics.  Mail remains the most commonly used bill pay channel regardless of household income, but higher-income households are the heaviest uses of online and automatic bill pay.  Among consumer credit cards, VISA has its slimmest lead over MasterCard in the case of the highest income earners ($150K or more).  Channel preferences similarly vary by levels of educational attainment. Non-high school graduates are the heaviest users of in-person bill pay, while those with graduate degrees are the heaviest users of online payment.  But everything is not that simple:  as household education levels increase, use of mail and automatic bill payments both increase.  Hispanics are the most likely to pay their bills in person, while Asians are the most likely to pay their bills online.

At the same time, as reported in our study on Consumer Payments in the U.S.:Trends Driving the Credit, Debit, and Prepaid Card Industries, generational cohorts use payment products and channels differently.  And within generational cohorts, many behaviors and preferences vary by factors such as income and education levels.

The accumulation (or lack thereof) of life experiences gives each generation its own voice, a unique receptivity to marketing messages and preferences for technology and channels. These differences create significant challenges but also creative opportunities for marketers who target cohorts with the style and substance to which they respond.

Millennials, for example, may well be the first generation in America that is truly downwardly mobile. On average, younger workers are earning less than previous generations when they were the same age. They are also facing high rates of unemployment.  Add to that $1 trillion in outstanding student loans—a 900% increase over 1997.

Not surprisingly, then, only 37% Millennials have or use credit cards, compared with 62% of adults overall.  Relatively speaking, nonetheless, on which credit card are Millennials disproportionately likely to charge it?  American Express, which doubles its market share among the highest earners.   Youth too has its privileges.

Thursday, April 28, 2011

Trends in U.S. Military and Correctional Facility Food and Foodservice

Featured Publication:
Trends in U.S. Military and Correctional Facility Food and Foodservice


For food and foodservice manufacturers, suppliers and operators, speaking the language of the military is big business, which Packaged Facts’ Trends in U.S. Military Food and Foodservice helps participants translate into increased sales.

Fact: The U.S. Department of Defense is the nation’s largest employer and a gateway to more than 3.2 million people.

Fact: The scope of military reach extends to the more than 12 million military members, families and retirees who depend on its wide net of retail, military installation, and combat food and foodservice operations, which have an international reach that incorporates everything from food and beverage supply to foodservice management to restaurant franchising.

This new market study assesses the attitudes toward various on-installation and off-installation foodservice options as well as, analyzes off-site foodservice spending among military service members, military spouses, civilians and retirees.
 
The report covers food and foodservice operations at military installations, including mess halls, exchanges and recreational facilities; and food and foodservice field training and contingency operations. While it focuses primarily on domestic military food and foodservice, the report also presents global U.S. military foodservice sales and trend analysis.
 
As a bonus, the report also includes an overview of the U.S. correctional facilities foodservice market, including growth drivers, market sizing and forecasting, prison cost trends, state correctional facility budgeting trends, state prison count reduction strategies, foodservice cost analysis, and foodservice cost cutting initiatives.

Baked Goods: Culinary Trend Mapping Report

For the past several years, consumers have been soothing themselves with all manners of baked goods, ranging from freshly made pies and Parisian macarons to decadent cookies and oozing lava cakes - all while enjoying new twists on old favorites as well as a more varied selection of baked goods and flavors.

Despite recent economic difficulties, baked goods generally remain an affordable indulgence, and one consumers can access in many places. The recession hasn't prevented sales of baked goods from growing, as the market has been pushed by a variety of drivers: convenience, premium ingredients, global flavor twists, wellness and nostalgia/comfort.
 
In Baked Goods: Culinary Trend Mapping Report, Packaged Facts and the Center for Culinary Development use the CCD signature Trend Mapping technique to profile seven sweet and savory baked good trends that provide fresh ideas for manufacturers and restaurant operators to enliven stale offerings, spruce up the bread basket and add excitement to both the baking aisle and freezer case.
The seven sweet and savory baked good trends appearing across the Trend Map® include:
  • Stage 1: The Micropatisserie
  • Stage 1: Alfajores
  • Stage 2: Popovers & Gougres
  • Stage 3: Specialty Frozen Desserts
  • Stage 3: Better Baking Mixes
  • Stage 4: Pretzel-mania
  • Stage 5: Gone Gluten-Free

Children's Food and Beverage Market in the U.S.

New Market Research:Children's Food and Beverage Market in the U.S.
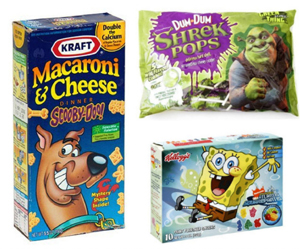
There are a number of reasons why food marketers are developing products specifically for the 2- to 12-year-old age group. For starters, this demographic represents about one-seventh of the population. Also, life-long dietary habits are established at this early age, and brand loyalty begins.

These factors and more are influencing the $10 billion market for children’s food and beverages. Take advantage of this market study to:
  • Understand the shopping behaviors of your top customers.
  • Assess new product introductions as well as, the competitive marketing action plans of key industry players.
  • Identify with your client: what motivates kids when it comes to food, beverages and ingredients and flavors.
  • Learn the tactics retailers are implementing in marketing to kids.
  • Analyze food advertising campaigns geared toward Kids in the 21st Century.
  • Evaluate the market composition in seven distinct categories broken down by dollar sales and percent share for strategic perspective and forecasting.
More information:
Price/Info   |   Table of Contents   |   Place an Order

Wednesday, April 13, 2011

Opulent lodgings arise in Boston strictly for pets - The Boston Globe

Opulent digs arise in Hub strictly for the 4-legged set


The Boston Globe | Beth Teitell | 13 Apr 2011


With 91 percent of owners calling their pet a member of the family and with the economic downturn easing, there is increasing demand for luxury pet lodging, according to a report by Packaged Facts, a Maryland research firm. Many facilities have added upscale amenities, such as customized suites with individualized decor or advanced air purification systems, according to the company’s most recent report.


Unlike the kennels of the past, with their chain-link fences and concrete floors, luxury pet hotels offer more than just flat-screen televisions. There are webcams, spas, airy rooms, and, increasingly, cage-free sleeping arrangements that allow pets to sleep on a bed with a hotel employee or engage in slumber parties with other (well behaved) animals.

Learn more about the 2011 - 2012 Pet Market Outlook

View the complete article

Tuesday, April 12, 2011

Functional and Natural Ready-to-Drink Beverages in the U.S. : Packaged Facts

Packaged Facts’ Functional and Natural RTD Beverages in the U.S. offers a comprehensive look at the $21 billion market for single-serve, ready-to-drink (RTD) beverages across three categories and several competing product segments: (1) energy drinks/shots, sports drinks, and nutrient-enhanced waters, in itself a $15 billion category; (2) RTD tea and coffee, and (3) refrigerated yogurt drinks and juice/fruit smoothies. A 7% aggregate compound annual growth rate for these products over the most recent five-year period is a testament to the strength of the market before 2007 and since 2010. In the recessionary years of 2008 and 2009, most of these product segments flat-lined in sales growth, in keeping with the overall sales slump in foods and beverages as well as in the U.S. consumer economy overall. By 2010, nonetheless, energy/sports drinks and RTD tea/coffee showed renewed dynamism, signaling the onset of a new cycle of sales growth for these convenience, refreshment and re-charge beverages. However controversial some energy drinks may be, this lively product segment continues to call the shots in the market, accounting for 44% of the total product introductions in 2010. Many new product introductions in rival “pick up, pick me up” beverage segments are clearly marching to the beat of energy drinks or energy shots, and the newest product segment in this market, nutrient-enhanced waters, competes as a lighter re-mix of energy/sports drinks.

Functional and Natural RTD Beverages in the U.S. examines sales and trends across the retail spectrum, using proprietary primary data from Packaged Facts' March 2011 food shoppers Insights survey as well as retail sales-tracking data from Information Resources, Inc. InfoScan Review for mass channels and SPINSscan Review for the natural channel. This report tabulates market composition by product category and retail channel, as well as marketer/brand shares within and across product segments. The analysis pays special attention to cross-category trends in new product development, drawing on comprehensive new product data from Datamonitor’s Product Launch Analytics database, and analyzes consumer usage (including demographic and psychographic context) based on current and five-year-trended Experian Simmons national consumer survey data.


Functional and Natural Ready-to-Drink Beverages in the U.S. : Packaged Facts

Tuesday, March 29, 2011

New Research Study:Trends in U.S. Hospital, Nursing Home and Residential Facility Foodservice

Healthy 50+ Americans: Trends and Opportunities in the Emerging Wellness Market

New Research Study:Trends in U.S. Hospital, Nursing Home and Residential Facility Foodservice


Reaching $34 billion last year, the future of hospital & nursing and residential care foodservice is bright. This marketplace is awash with change and innovation, as foodservice operators struggle to make sense of government healthcare spending while meeting personal patient food and flavor expectations.

If you are a foodservice operator in the healthcare industry, the revealing, expert analyses in this report will help you articulate better business and marketing plans going forward.
The market study will help you:

  • Leverage new marketing opportunities in women’s nutrition and tailored foodservice programs around family caregivers.

  • Learn the market value of “meal opportunity” for inpatient and outpatient hospital, assisted living, and hospital employee settings.

  • Analyze the win-win proposition for hospital foodservice with a restaurant brand that forcefully plays the health card.

  • Asses “primary” with positive momentum: Room service and individualized patient care; customer service; wellness and nutrition; variety and culinary exploration; sustainability and green initiatives; and the need for speed.

A special feature of this report is Packaged Facts' own exclusive proprietary data.


This Packaged Facts report maps key trends and policies shaping sales growth and potential, and provide in-depth profiles of hospital foodservice programs and hospital and nursing home foodservice contractors.

More information:
Price/Info   |   Table of Contents   |   Place an Order


Market Research: Hispanic Food and Beverages in the U.S.: Market and Consumer Trends in Latino Cuisine

Healthy 50+ Americans: Trends and Opportunities in the Emerging Wellness Market

Market Research: Hispanic Food and Beverages in the U.S.: Market and Consumer Trends in Latino Cuisine

With Hispanic foods and beverages achieving such prominence, it’s no wonder Packaged Facts analyses finds the market will aggressively grow to more than $9 billion in 2014.

If you are a food marketer, this market study will help you take your business to the next level of success with a thorough analysis of the latest trends and opportunities in the Hispanic food and beverage market.

This insightful market study will help you:

  • Develop targeted marketing promotions, personalized to the growing tastes for Hispanic foods and beverages

  • Benchmark your top competitors and their retail and foodservice initiatives

  • Explore demand based on eight product categories driving growth

  • Understand the dynamics of the market and identify possible partnerships

  • Embrace key trends such as the new 'foodie' and the mixing health aspects of Hispanic cuisine

  • Decipher the inner-workings of the Hispanic foods and beverages consumer

  • Learn which retail outlets are gaining market share and how you can incorporate

In addition to covering packaged products sold through retail, Hispanic Food and Beverages in the U.S.: Market and Consumer Trends in Latino Cuisine includes qualitative and quantitative information on foodservice sales through channels such as fast-food outlets, sit-down restaurants, mobile units, etc.

More information:
Price/Info   |   Table of Contents   |   Place an Order