Trends in U.S. Military and Correctional Facility Food and Foodservice
This new market study assesses the attitudes toward various on-installation and off-installation foodservice options as well as, analyzes off-site foodservice spending among military service members, military spouses, civilians and retirees.
The report covers food and foodservice operations at military installations, including mess halls, exchanges and recreational facilities; and food and foodservice field training and contingency operations. While it focuses primarily on domestic military food and foodservice, the report also presents global U.S. military foodservice sales and trend analysis.
As a bonus, the report also includes an overview of the U.S. correctional facilities foodservice market, including growth drivers, market sizing and forecasting, prison cost trends, state correctional facility budgeting trends, state prison count reduction strategies, foodservice cost analysis, and foodservice cost cutting initiatives.

Baked Goods: Culinary Trend Mapping Report
 For the past several years, consumers have been soothing themselves with all manners of baked goods, ranging from freshly made pies and Parisian macarons to decadent cookies and oozing lava cakes - all while enjoying new twists on old favorites as well as a more varied selection of baked goods and flavors.
 In Baked Goods: Culinary Trend Mapping Report, Packaged Facts and the Center for Culinary Development use the CCD signature Trend Mapping technique to profile seven sweet and savory baked good trends that provide fresh ideas for manufacturers and restaurant operators to enliven stale offerings, spruce up the bread basket and add excitement to both the baking aisle and freezer case.
The seven sweet and savory baked good trends appearing across the Trend Map® include:
- Stage 1: The Micropatisserie
- Stage 1: Alfajores
- Stage 2: Popovers & Gougres
- Stage 3: Specialty Frozen Desserts
- Stage 3: Better Baking Mixes
- Stage 4: Pretzel-mania
- Stage 5: Gone Gluten-Free
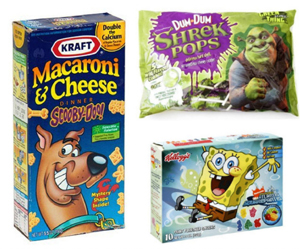
Children's Food and Beverage Market in the U.S.
 New Market Research:Children's Food and Beverage Market in the U.S.
These factors and more are influencing the $10 billion market for children’s food and beverages. Take advantage of this market study to:
- Understand the shopping behaviors of your top customers.
- Assess new product introductions as well as, the competitive marketing action plans of key industry players.
- Identify with your client: what motivates kids when it comes to food, beverages and ingredients and flavors.
- Learn the tactics retailers are implementing in marketing to kids.
- Analyze food advertising campaigns geared toward Kids in the 21st Century.
- Evaluate the market composition in seven distinct categories broken down by dollar sales and percent share for strategic perspective and forecasting.
Wednesday, April 13, 2011
Opulent lodgings arise in Boston strictly for pets - The Boston Globe
Opulent digs arise in Hub strictly for the 4-legged set
The Boston Globe | Beth Teitell | 13 Apr 2011

Unlike the kennels of the past, with their chain-link fences and concrete floors, luxury pet hotels offer more than just flat-screen televisions. There are webcams, spas, airy rooms, and, increasingly, cage-free sleeping arrangements that allow pets to sleep on a bed with a hotel employee or engage in slumber parties with other (well behaved) animals.
Learn more about the 2011 - 2012 Pet Market Outlook
View the complete article
Tuesday, April 12, 2011
Functional and Natural Ready-to-Drink Beverages in the U.S. : Packaged Facts
Functional and Natural RTD Beverages in the U.S. examines sales and trends across the retail spectrum, using proprietary primary data from Packaged Facts' March 2011 food shoppers Insights survey as well as retail sales-tracking data from Information Resources, Inc. InfoScan Review for mass channels and SPINSscan Review for the natural channel. This report tabulates market composition by product category and retail channel, as well as marketer/brand shares within and across product segments. The analysis pays special attention to cross-category trends in new product development, drawing on comprehensive new product data from Datamonitor’s Product Launch Analytics database, and analyzes consumer usage (including demographic and psychographic context) based on current and five-year-trended Experian Simmons national consumer survey data.
Functional and Natural Ready-to-Drink Beverages in the U.S. : Packaged Facts